Environmental Engagement Goes Community Wide
March 15, 2013
Erich Burnett
North Americans spend 90 percent of their lives inside buildings. We are surrounded by invisible whirlwinds of electricity and water flowing through a web of wires and pipes buried in ceilings, floors, and walls, feeding through hidden vaults and closets, embedded within and above our streets and sidewalks, and penetrating every place in which we live and work.
Although we rarely give much thought to this world, the dynamic flow of resources represents a powerful manifestation of human relationships—relationships with each other, with technology, and with the natural world that make modern life possible.
The question that a group of faculty and students have been asking is: What might our world
be like if these flows were somehow animated and publicly displayed in ways that allow us to understand and emotionally connect with the implications of our choices?
This is the question that faculty members—John Petersen, environmental studies, Cindy Frantz, psychology, and Rumi Shammin, environmental studies— and a cadre of student collaborators are grappling with. For more than a decade, and with grants from the U.S. Environmental Protection Agency, the Ohio Foundation of Independent Colleges, and the Great Lakes Protection Fund, they have been developing new technologies for monitoring and displaying resource use that are explicitly designed to engage, educate, motivate, and empower students and citizens of Oberlin to become aware of—and then take greater responsibility for and control over—the flows around them.
Accomplishments started with the development of a sophisticated monitoring and display system for Oberlin’s Lewis Center for Environmental Studies. This was followed by the creation of the Campus Resource Monitoring System, which allows students in dorms to track their resource use, then Environmental Orbs, installed in the hallways of most Oberlin dorms, that glow in different colors depending on how much electricity and water are being consumed in the dorm at a given moment.
Late in 2012, the group began the initial rollout of its most ambitious effort to date: the Environmental Dashboard, a suite of technologies and approaches that extend what has been learned on campus into the larger Oberlin community. The concept is to make the invisible flows of water and electricity through buildings and through the city more visible and engaging, and to link them to the thoughts and actions of citizens working to build a more vibrant, resilient, and sustainable Oberlin.
There are three core components of the Environmental Dashboard. First, Building Dashboards measure electricity and water consumption in individual buildings—schools, businesses, public facilities, and homes—and translate this into animated web-based displays. Second, the Bioregional Dashboard is an animated real-time display of current electricity and water use and environmental conditions though the entire community, narrated by cartoon characters. Finally, Community Voices” combines photographs, artwork, thoughts, ideas, and actions of community members and groups to celebrate and encourage positive action. These three components are combined on electronic signage being installed in downtown Oberlin and on the oberlindashboard.org website.
“The explosion in so-called ’green technologies’ in the last decade—photovoltaics, hybrid cars, the ‘smart grid,’ more efficient appliances, etc., has focused principally on how to do what we are already doing with fewer resources or with renewable resources, but has largely avoided engaging people in decisions that extend beyond shifting choices related to what products to buy,” says Petersen. “We are attempting to develop a fundamentally different kind of technology that is explicitly designed to change the way people think about themselves and act in relation to ecological and social community.”
“This really is, in many ways, a first of its kind in the country,” says Andrew DeCoriolis ’07, director of marketing for Oakland, California-based Lucid Design Group. Founded by three Oberlin graduates, Lucid licenses feedback technology with businesses and universities that hope to save money on resources while enlightening their workforce or campus population. Extrapolating such a model across an entire community mostly exists in the realm of fantasy. But in Oberlin, a long-brewing dream is coming true.
According to preliminary research conducted by students, the Bioregional Dashboard’s
depiction of Oberlin’s resource system significantly raises citizens’ awareness and sense of belonging to that system. And ultimately, it leads to more environmentally conscious behavior.
The notion finds its origins in work led by Frantz. Her interest centers on measuring citizens’ sense of emotional connectedness to nature, and how introduction of data on energy and water usage affects such feelings.
“Environmental issues are so relevant at this time, and psychology is such an interesting lens to view them through,” says third-year student Evan Tincknell. A dual major in environmental studies and psychology, Tincknell spent his summer using the technology to assess test subjects’ perceived awareness of their environment and their attitudes of connectedness to nature. In January, he presented his findings at a conference in New Orleans.
“You wouldn’t think that one little screen would have such an impact on their world,” says Tincknell, “and that’s been really neat to see.”
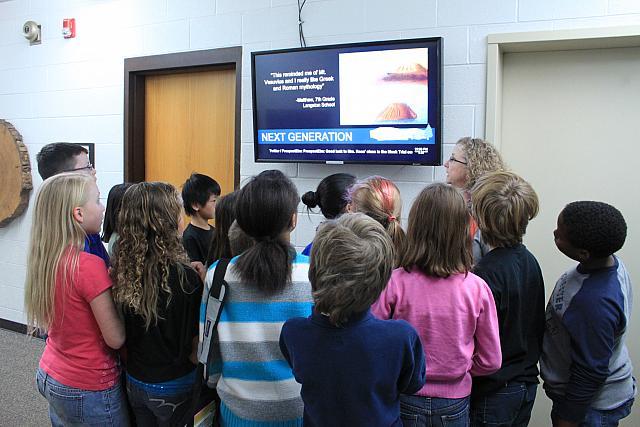
Shane Clark, a third-year student majoring in environmental studies, has been monitoring response to the Bioregional Dashboard among kids and adults at Prospect Elementary. It’s what she calls a brief “sitting back and admiring phase,” after months of development. During spring semester, she’s continuing her research on the project’s impact in the community, with the goal of working out any bugs that may arise in terms of user experience.
Petersen’s own daughter, a student at Prospect, offered some of the first feedback by conducting an informal survey of her own, which she shared with her dad at home.
“The number-one complaint among students was that there are too many kids crowding around the screen!” he says.
That’s one bug that may take some time to work out.
Tags:
You may also like…
Oberlin’s Sustainable Infrastructure Program Reaches Major Milestone
December 4, 2024
Geothermal heating and cooling system comes online, supports Oberlin reaching 100 percent carbon neutrality by 2025.

Oberlin’s Sustainable Infrastructure Program Enters Key Phase
May 30, 2023
Four-year project to convert campus heating and cooling system set for drilling of 850 geothermal wells.